
The short version
By the Bollinger Strategy editorial team · Published 4 November 2026 · How we research and check these guides
In mid-August 2026 the 4-hour Bollinger Bands on OKX’s BTC-USDT perpetual got narrower than at any point in the 110 days we measured. Three days after that low point price was about 10% higher. Five days after the first breakout, the highest 4H close was 23.7% above the breakout close. This guide walks through the move candle by candle with BOLL20 and BOLL90, then shows the less flattering part: similar squeezes in September produced failed breakouts.
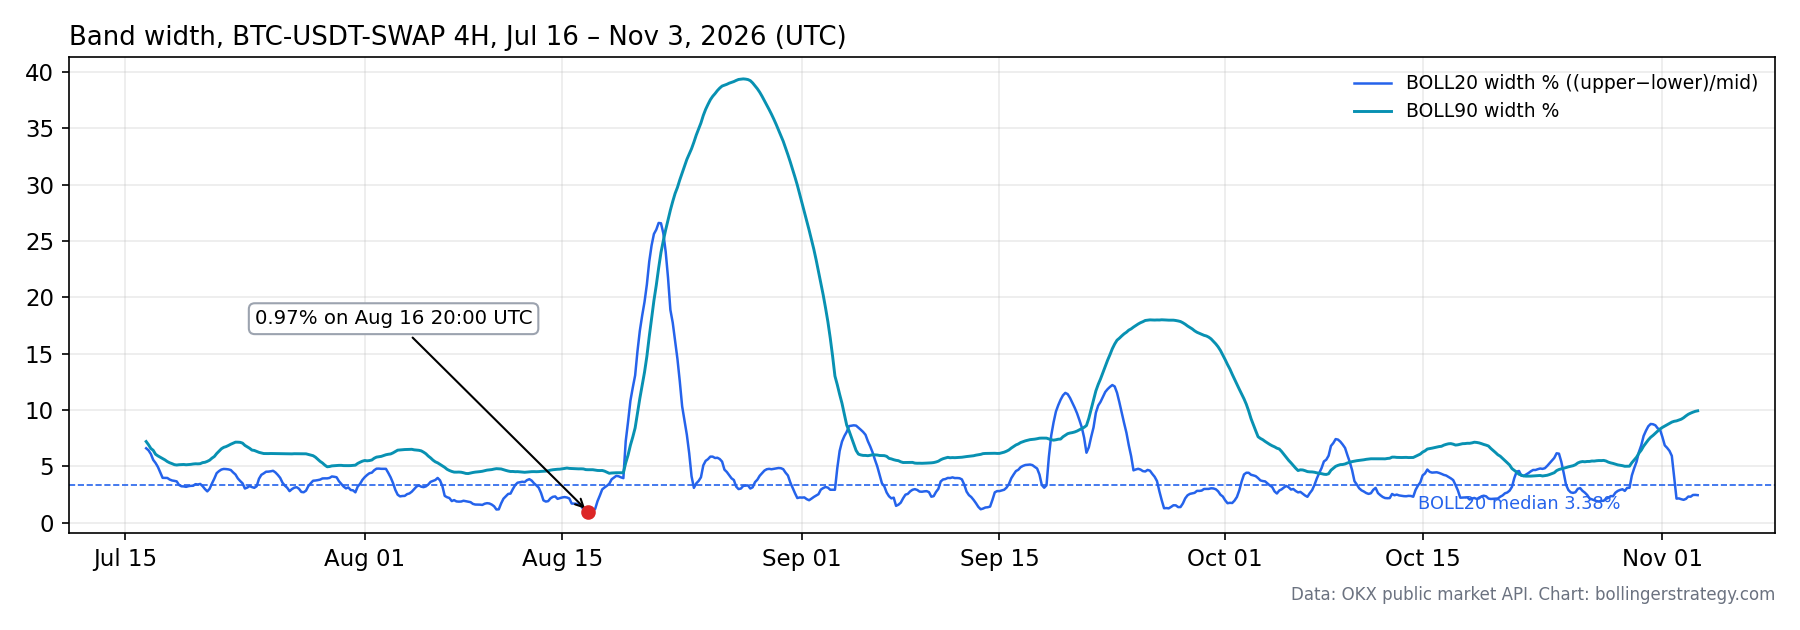
- Squeeze: BOLL20 width fell to 0.97% of price on the 16 August 20:00 UTC candle. The median width over the sample was 3.38%.
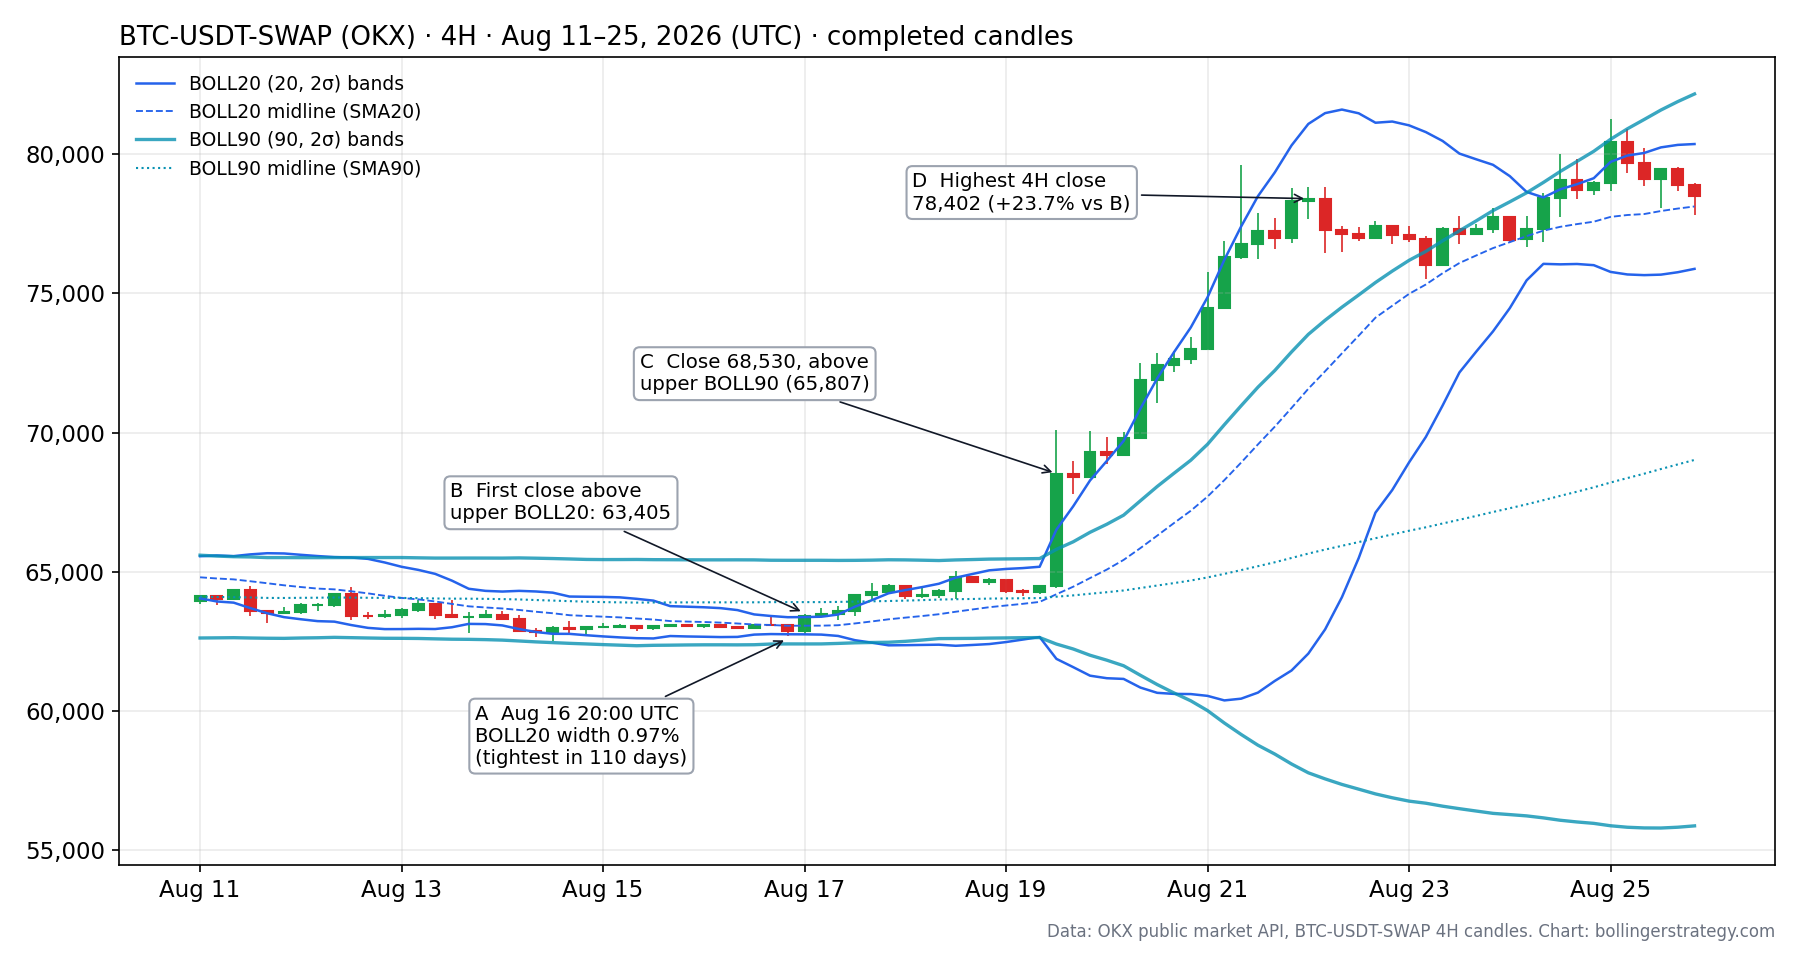
- First signal: the next candle closed above the upper BOLL20 band at 63,405. For two and a half days price went almost nowhere.
- Real expansion: on 19 August one 4H candle moved from 64,478 to a 68,530 close, above the upper BOLL90 band at 65,807.
- Result: the highest 4H close was 78,402 on 22 August, 23.7% above the breakout close. Price first closed below the 20-period midline on 26 August at 77,980, 23.0% above the breakout close.
- Caveat: across all 32 BOLL20 breakouts in the sample, price was higher in the breakout direction four days later only 44% of the time.
Settings and what we measured
All numbers come from completed 4-hour candles of BTC-USDT-SWAP on OKX, retrieved from OKX’s public market API on 3 November 2026. Times are UTC and refer to the candle’s open.
- BOLL20: 20-period simple moving average of closes, plus and minus 2 standard deviations. This is the common default in charting tools.
- BOLL90: the same calculation over 90 periods. On a 4H chart that is 15 days, so it shows the larger range that the 20-period band sits inside.
- Band width: (upper band − lower band) ÷ middle band, shown as a percent. This is John Bollinger’s BandWidth. A width of 1% means the whole BOLL20 envelope was 1% of price tall.
Width is the number to watch, not the look of the bands. Bands always look narrow when you zoom out after a big move. Comparing width with its own recent history tells you whether a squeeze is unusual for this market.
Stage A: the squeeze (13–16 August)
BOLL20 width dropped under 2% at 16:00 UTC on 13 August and stayed between roughly 1.5% and 2.3% for three days. On 16 August it tightened again, reaching 0.97% at 20:00. In 110 days of 4H candles, only eight days had any candle with width below 1.5%.
BOLL90 barely moved during this time. Its bands sat near 62,409 and 65,413, a range of about 4.7%. The short-term band had collapsed to a 600-point corridor inside a 3,000-point box that had held for two weeks.
Funding on the perpetual was also quiet. Realized funding stayed between 0.0046% and 0.0100% per 8 hours from 13 to 16 August. That is normal and does not suggest a crowded long or short.
Stage B: the first breakout did very little (17–19 August)
The 17 August 00:00 candle closed at 63,405, just above the upper BOLL20 band at 63,373. That is the textbook squeeze breakout. Someone who bought it would then have waited 60 hours with very little happening:
- The lowest low before the real move was 63,261, only 0.23% under the breakout close.
- The highest high was 65,037 on 18 August, just under the upper BOLL90 band, which sat near 65,430 at the time.
Many guides say to take squeeze breakouts only in the direction of the longer trend. Here the close was below the BOLL90 midline (63,911), so that filter would have skipped the trade. We return to this filter below, because in our sample it did not help.
Stage C: price leaves the bigger box (19 August)
The 12:00 UTC candle on 19 August opened at 64,478, traded as high as 70,099 and closed at 68,530, a 6.3% gain in four hours. The 70,099 high is OKX’s print. Wick extremes differ between exchanges, so the same candle on another venue may show a slightly different high.
More important than the size was where the candle closed: above the upper BOLL90 band at 65,807. Price had now broken out of both the short-term corridor and the two-week box.
BOLL20 width jumped from 4.0% to 7.2% in that one candle and kept widening for three days, peaking at 26.6%. BOLL90 width went from 4.4% to more than 30% by 23 August.
Stage D: walking the band (19–26 August)
After the breakout, closes stayed near the upper BOLL20 band. The first close back inside the band came at 16:00 UTC on 20 August, at 72,650. Some traders treat that as an exit signal. Here it would have left most of the move behind: the highest 4H close was 78,402 on 22 August.
A slower rule worked better in this case. Price did not close below the 20-period midline until 12:00 UTC on 26 August, at 77,980. Measured from the first breakout close at 63,405 that is +23.0%. Measured from the BOLL90 breakout close at 68,530 it is +13.8%.
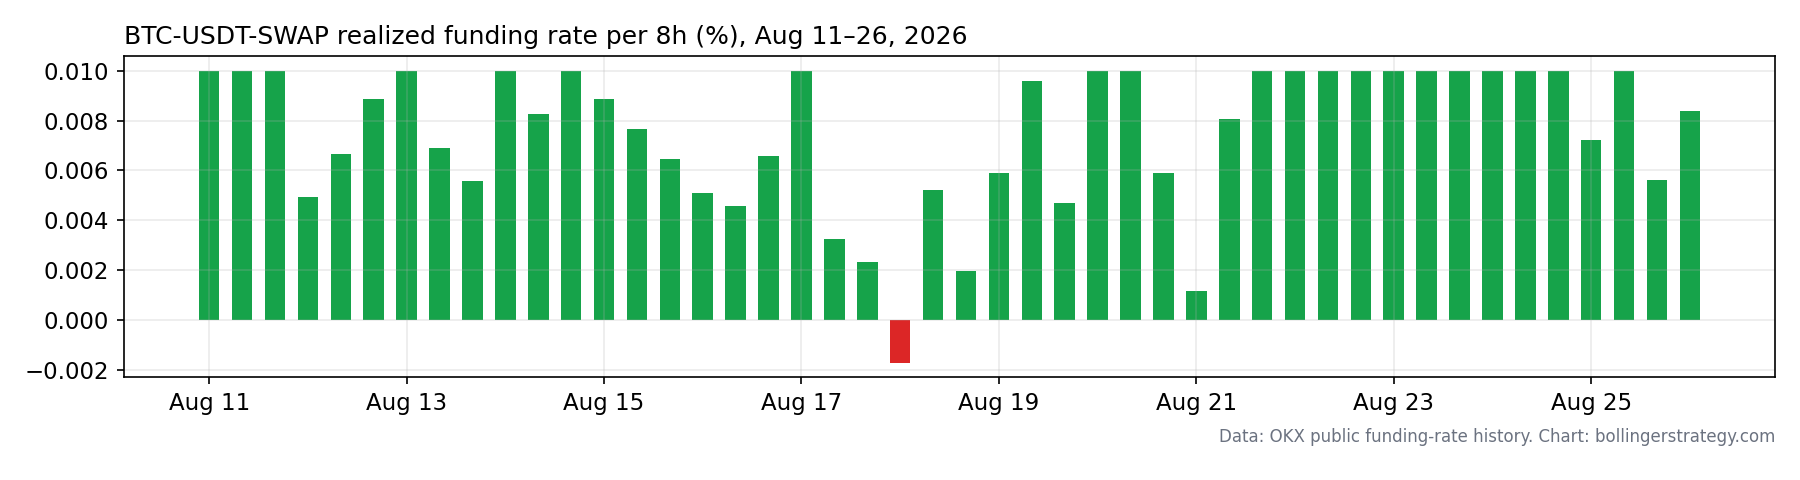
On a perpetual you pay or receive funding every 8 hours, so holding for days has a cost. Here it was small. A long held from the 17 August breakout to the 22 August high paid 15 funding periods totaling about 0.086% of position value. Funding stayed at or below 0.010% per period, so the rally was not driven by one-sided leverage that had to be unwound.
The part most squeeze guides leave out
One good example proves little. We took every case in the sample where a 4H candle closed outside BOLL20 after at least six candles inside, and measured where price was 24 candles (four days) later, in the direction of the breakout.
| Group | Cases | Average after 4 days | Median | Share positive |
|---|---|---|---|---|
| All BOLL20 breakouts | 32 | −0.14% | −0.56% | 44% |
| Width in lowest 20% of previous 120 candles | 10 | +1.78% | +0.58% | 50% |
| Same, excluding 17 August | 9 | +0.03% | −0.11% | 44% |
| Breakout on the same side of the BOLL90 midline | 23 | −1.14% | −0.96% | 39% |
| Breakout on the opposite side of the BOLL90 midline | 9 | +2.41% | +0.34% | 56% |
“Same side of the BOLL90 midline” means the breakout close was on the side of the 90-period midline that matches the breakout: an upside breakout above the midline, or a downside breakout below it. It does not refer to the slope of the midline.
Three things stand out. A plain close outside BOLL20 was close to a coin flip. Without the August case, squeezes had no edge either: an average of +0.03%, a median of −0.11% and 4 of 9 positive, the same 44% as all breakouts. And the popular “trade with the longer trend” filter made results worse here. With 32 cases from one market over 110 days, none of these numbers is reliable enough to trade on. They are a reason to be skeptical of any squeeze rule shown with a single chart.
Two September squeezes that failed
14 September. BOLL20 width was 1.37%, almost as tight as in August. The 04:00 UTC candle closed above the upper band at 77,855. Four days later price was slightly lower, and along the way it fell 3.8% below the breakout close. In between, a downside breakout on 15 September at 75,611 also failed: price rose more than 8% against it within four days.
27 September. Width was 1.54%. An upside close at 84,857 was 1.15% lower four days later, with a worst point 2.8% below the breakout close.
Both looked like the August setup at the moment of the breakout. The difference only showed later, when price either did or did not get through the BOLL90 band.
Reading a squeeze on your own chart
- Measure width. Compare BOLL20 width with its own last few weeks. On BTC 4H in this period, anything under about 1.5% was rare.
- Treat the first close outside BOLL20 as an alert. In August it came 60 hours before the real move. In September it led nowhere.
- Use BOLL90 as the bigger box. A close outside the BOLL90 band said more about the August move than the BOLL20 breakout did.
- A close back inside BOLL20 did not end the August walk. A close below the 20-period midline was a slower, simpler line to watch.
- If you trade a squeeze with leverage, size for it. A 1–2% squeeze range sounds small, but at 10x leverage a 2% move against the position is 20% of margin. A stop beyond the other side of the squeeze range only protects you if the position is small enough that reaching it cannot trigger liquidation first.
- If you hold for days, check funding. Here it cost under 0.1%. When funding is several times higher, it can take a meaningful share of a move.
Check the current BTC 4H chart
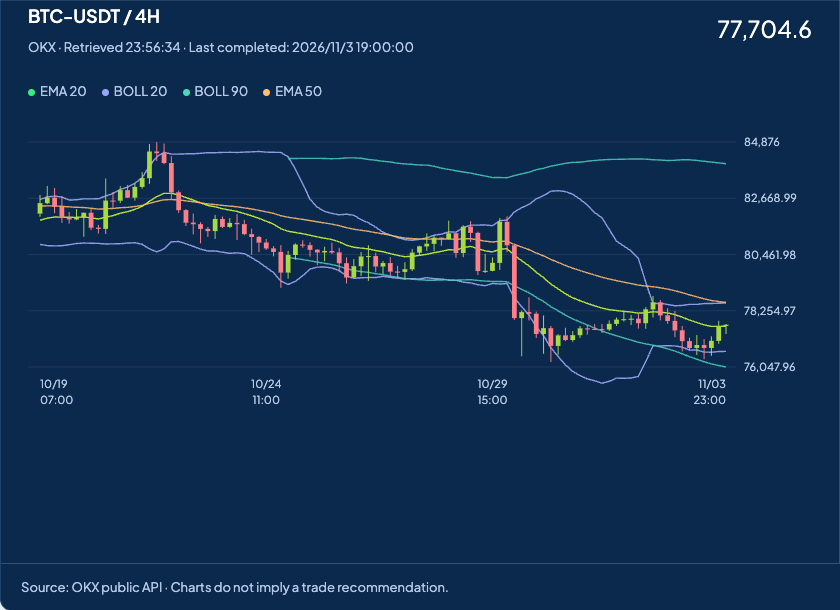
The free BTC-USDT-SWAP chart on this site draws BOLL20, BOLL90, EMA20 and EMA50 from the same OKX data. Switch the timeframe to 4H to see where width is now.
For background on the two bands, see how BOLL20 and BOLL90 are read and the signal rules for completed candles. The BTC-USDT-SWAP guide covers the contract itself, and the learning guide has a checklist for reviewing a band crossing. Market insights explains what OKX data can and cannot tell you.
Frequently asked questions
How narrow do Bollinger Bands have to be to count as a squeeze on the BTC 4H chart?
There is no fixed number. Compare BandWidth with its own recent history. From 16 July to 3 November 2026 the median BOLL20 width on the BTC-USDT-SWAP 4H chart was 3.38%, and widths under 1.5% appeared on only eight days. A reading that is rare for this market matters more than a reading that only looks narrow.
Does a squeeze tell you which way price will break?
No. BandWidth measures volatility, not direction. In August the upside breakout continued. On 14 September an upside breakout failed, and the downside breakout that followed on 15 September failed too.
What does BOLL90 add to a BOLL20 chart?
On a 4H chart, 90 candles cover 15 days, so BOLL90 shows the larger range that BOLL20 moves inside. In August the first BOLL20 breakout stalled just under the upper BOLL90 band, and the large move began when price closed above it. Using the BOLL90 midline as a direction filter did not help in our sample.
How do I estimate the funding cost of holding a perpetual for several days?
Add up the funding rate of every 8-hour period you hold and multiply by the position value. Long positions pay when the rate is positive. From 17 to 22 August the 15 periods summed to about 0.086%, so a 10,000 USDT long paid roughly 8.6 USDT. Rates change every period, so check the exchange’s funding history for the dates you hold.
Sources, data and method
- OKX API v5 — Get candlesticks history ↗ (instId BTC-USDT-SWAP, bar 4H, 800 candles from 23 June to 3 November 2026)
- OKX API v5 — Get funding rate history ↗ (realized rate per 8-hour period)
- John Bollinger — Bollinger Band rules ↗, including the definitions of BandWidth and %b
- Only completed candles were used. Earlier candles were used only to warm up BOLL90 and the 120-candle width ranking, so measurements start on 16 July 2026.
- Standard deviation is the population standard deviation of closes, as in most charting software.
- “After 4 days” is the close 24 candles after the breakout candle, signed in the breakout direction. It ignores fees, funding and slippage. It is not a strategy backtest.
- The candles, funding records and calculation script used for this page are archived by the editorial team. If a number does not match your own data, tell us and we will check it.
This is an educational review of past market data, not a trade recommendation. Perpetual futures use leverage and losses can exceed what you expect. Past behavior of an indicator does not predict future results.