
The short version
By the Bollinger Strategy editorial team · Published 4 November 2026 · How we research and check these guides
We tested Bollinger Band lengths of 10, 20 and 50 and multipliers from 1.5 to 3 standard deviations on OKX’s BTC-USDT perpetual swap, using one year of 1-hour and 4-hour candles and three years of daily candles. The goal was to see what each setting actually does on a crypto perpetual, including trading fees and funding, before picking one.
- The 2σ band is not a 95% band on crypto. With the standard 20, 2 setting, 13.0% of 1H closes, 13.3% of 4H closes and 11.8% of daily closes landed outside the bands, against 4.6% for a normal distribution.
- The timeframe matters more than the numbers. On 1H, the typical distance from a close outside the bands back to the middle band was 1.04%, so a 0.10% round-trip taker fee takes about a tenth of it. On 4H the same fee is about 4% of that distance, and on 1D about 1%.
- Reaching the middle band is not the same as making money. After a close outside the 20, 2 bands on 1H, price got back to the middle band first 54% of the time. The losing cases were larger, and the average result was −0.14% before costs and −0.24% after them.
- Changing the multiplier mostly changes how often you get a signal. Going from 2σ to 2.5σ roughly halved the signals on every timeframe. It did not turn the 1H result positive.
- Bands do not stop a trend. From 1 to 3 June 2026, twelve 4H candles in a row closed below the lower band while BTC fell 9.6%.
This guide only covers what the settings do. How narrow the bands must be to count as a squeeze is covered in our 4H squeeze case study. This is an educational review of past market data, not a trade recommendation. Perpetual futures use leverage, and losses can exceed what you expect.
What the two numbers change
A Bollinger Band setting has two parts. The length is how many candles the middle band (a simple moving average) and the standard deviation are calculated over. The multiplier is how many standard deviations the upper and lower bands sit from the middle. John Bollinger’s standard is 20 periods and 2 standard deviations, and the BTC chart on this site draws the 20-period bands that way, next to a 90-period set for the larger range.
- A shorter length makes the middle band follow price closely and the bands narrower. On 4H, the median distance from the middle to the 2σ band was 1.55% with length 10, 2.33% with length 20 and 3.72% with length 50.
- A higher multiplier moves the bands further out, so fewer closes reach them. It does not change the middle band.
- The same setting covers different amounts of time on different timeframes. Twenty 1H candles are under a day. Twenty 4H candles are three and a third days. Twenty daily candles are close to three weeks.
One detail is easy to miss. The bands use the standard deviation of the closes in the window, including the current close. With a short length this puts a hard ceiling on how far a close can be from the middle band: with 10 values, no close can be more than about 2.85 standard deviations away. In our data, a 10-period, 3σ band was never reached by a single close on any timeframe. Wicks can still cross it, because highs and lows are not part of the calculation.
How we tested
- Market: OKX BTC-USDT-SWAP, completed candles only, all times in UTC.
- Data: 8,760 1H candles and 2,190 4H candles from 4 November 2025 to 3 November 2026. For daily candles one year gives too few signals, so we used 1,096 daily candles from 4 November 2023 to 3 November 2026. We also checked the last year of daily candles on its own; the shares of closes outside the bands were within about 2 percentage points of the three-year figures.
- Bands: simple moving average of closes, population standard deviation of the same closes, the same formula the chart on this site uses.
- Signal: a close outside a band when the previous close was inside it.
- What we measured after a signal: we followed price for up to one band length (for example 20 candles for a 20-period band). We recorded which came first: a close back on the other side of the middle band, or a close a further band-distance beyond the signal close. If neither happened, we took the close at the end of that window. The “move to exit” is the change from the signal close to that exit close, counted in the direction of the middle band.
- Costs: 0.05% per side, a commonly published regular-tier taker rate for USDT perpetuals, so 0.10% for a round trip. Check OKX’s fee page ↗ for your own tier. Funding uses the average of the 278 realized 8-hour rates from 3 August to 4 November 2026, which was +0.0057% per period. The rate was positive in 92% of those periods, so on average shorts received funding and longs paid it. Older funding history is not available from the public endpoint, so this average is applied to the whole sample.
The middle-band measurement is a way to compare settings. It is not a trading strategy, and it ignores slippage, partial fills and liquidation. We will test a full lower-band entry with stops, fees and funding in a separate guide.
How often price closes outside the bands
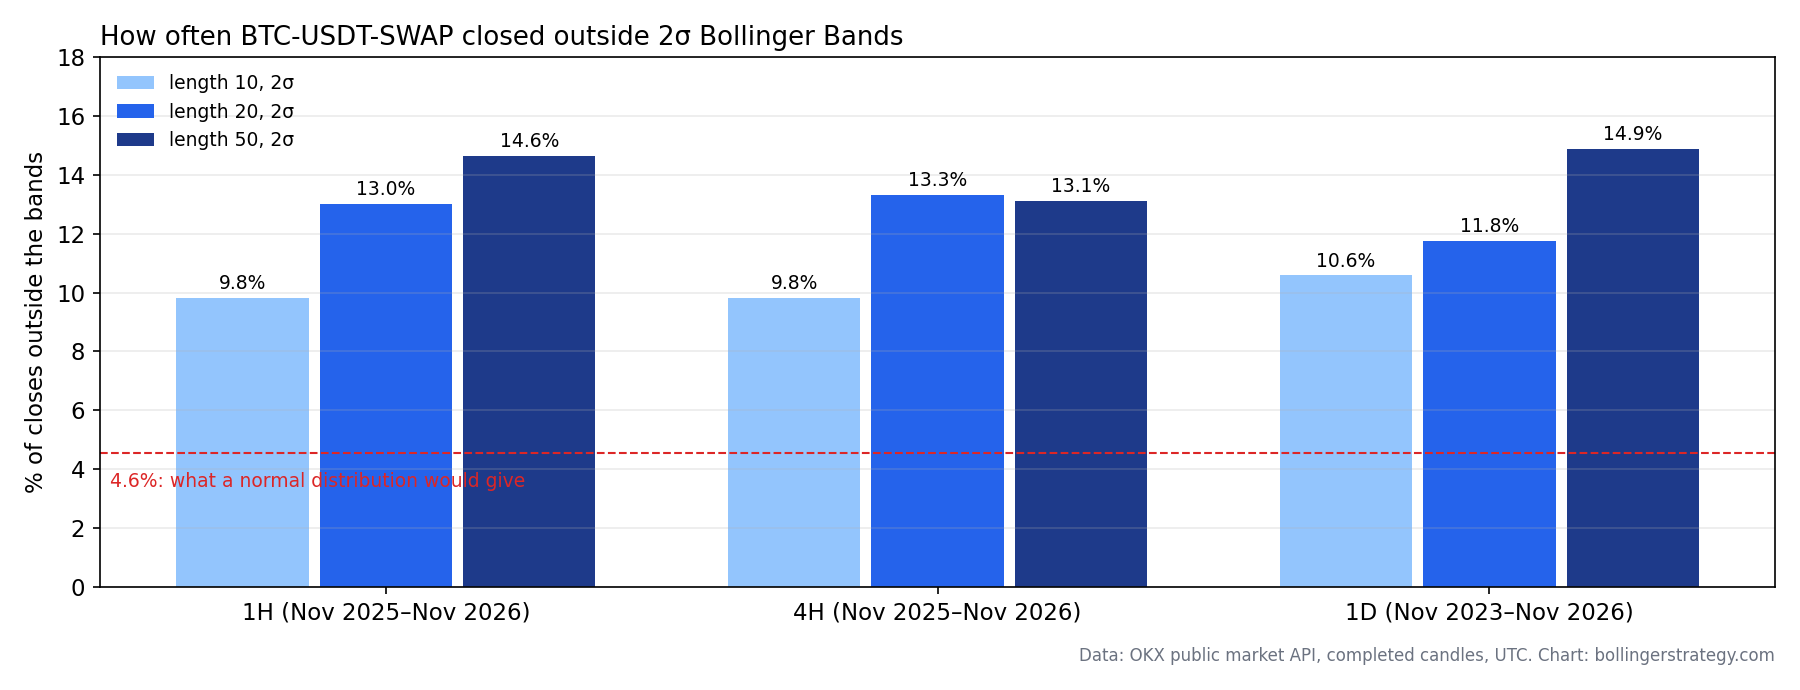
If price changes were normally distributed, about 4.6% of closes would land outside 2σ bands. On BTC perpetuals the real share was two to three times that on every timeframe. The table below shows the 20-period bands with four multipliers.
| Timeframe and period | Candles | 1.5σ | 2σ | 2.5σ | 3σ | Median distance, middle to band at 2σ |
|---|---|---|---|---|---|---|
| 1H · Nov 2025 – Nov 2026 | 8,760 | 27.6% | 13.0% | 5.3% | 1.7% | 1.07% |
| 4H · Nov 2025 – Nov 2026 | 2,190 | 28.3% | 13.3% | 4.9% | 1.1% | 2.33% |
| 1D · Nov 2023 – Nov 2026 | 1,096 | 28.9% | 11.8% | 3.4% | 1.3% | 6.56% |
| Normal distribution, for comparison | 13.4% | 4.6% | 1.2% | 0.3% |
Two things stand out. First, the share for each multiplier is similar on 1H, 4H and 1D, so the multiplier means roughly the same thing on any timeframe. Second, the distance from the middle band to the band itself grows a lot with the timeframe: about 1% on 1H, 2.3% on 4H and 6.6% on daily. That distance is what you have to compare with your costs.
In practice, a close outside the 2σ band on a BTC perpetual is not a rare event. With the 20, 2 setting it happened on about one 4H candle in eight. If you use a band touch as a signal by itself, expect many of them.
What happened after a close outside the bands
The next question is what price did after a signal. The table covers every signal in the sample, split by timeframe and setting.
| Timeframe | Setting | Signals | Per month | Back to middle first | Extended first | Average move to exit | After fees and funding |
|---|---|---|---|---|---|---|---|
| 1H | 10, 2σ | 630 | 52 | 61% | 34% | +0.04% | −0.07% |
| 1H | 20, 2σ | 523 | 44 | 54% | 43% | −0.14% | −0.24% |
| 1H | 50, 2σ | 363 | 30 | 57% | 40% | −0.05% | −0.15% |
| 1H | 20, 2.5σ | 291 | 24 | 55% | 38% | −0.17% | −0.27% |
| 4H | 10, 2σ | 166 | 14 | 67% | 30% | +0.06% | −0.04% |
| 4H | 20, 2σ | 138 | 12 | 60% | 34% | +0.16% | +0.05% |
| 4H | 50, 2σ | 82 | 7 | 66% | 34% | +0.30% | +0.19% |
| 4H | 20, 2.5σ | 72 | 6 | 68% | 26% | +0.32% | +0.22% |
| 1D | 10, 2σ | 80 | 2.2 | 62% | 35% | +0.21% | +0.12% |
| 1D | 20, 2σ | 63 | 1.7 | 63% | 33% | +0.35% | +0.26% |
| 1D | 50, 2σ | 38 | 1.1 | 61% | 39% | −0.91% | −0.94% |
| 1D | 20, 2.5σ | 24 | 0.7 | 46% | 42% | −2.02% | −2.09% |
Price went back to the middle band first in 54% to 68% of cases for most settings. That looks good, but the size of the moves matters more than the count. With the 20, 2 bands on 1H, the median winning case moved 0.72% toward the middle band. The median losing case, where price extended instead, moved 1.12% the other way. The average across all 523 signals was −0.14% before costs.
On 4H the same setting gave a median gain of 1.76% against a median loss of 2.42%, and an average of +0.16% before costs and +0.05% after. On daily, the 20, 2 average after costs was +0.26%, but the median loss when price extended was 6.69% and there were only 63 signals in three years. None of these averages is large enough, or based on enough cases, to treat as an edge.
Some results go against what many guides suggest:
- A wider multiplier did not help on 1H. The 20, 2.5 bands gave 291 signals instead of 523, and the average after costs was −0.27%, about the same as 2σ.
- On 4H, fewer and stricter signals looked better. The 20, 2.5 and 50, 2 settings both had higher averages than 20, 2. Both also had fewer than 85 signals in a year, so a few large cases can move the result.
- On daily, wider did worse. The 20, 2.5 bands had only 24 signals in three years, and the average after costs was −2.09%. With samples this small, one trending month decides the number.
Fees and funding by timeframe
Costs are where the timeframes really separate. Each signal on 1H has much less room to work with, while the fee is the same in percentage terms.
| Timeframe, BOLL(20, 2σ) | Median distance from signal close to middle band | Round-trip taker fee as a share of it | Median candles to reach the middle | Funding over that time at the average rate |
|---|---|---|---|---|
| 1H | 1.04% | 10% | 8 | 0.006% |
| 4H | 2.39% | 4% | 9 | 0.025% |
| 1D | 7.17% | 1% | 7 | 0.12% |
On 1H, a 0.10% round trip uses up about a tenth of the typical distance to the middle band before slippage. On 4H it is about 4%, and on daily about 1%. Funding was a small factor in this period because the rate stayed between −0.0047% and +0.0100% per 8 hours. Over the median holding time it added up to 0.006% on 1H and 0.12% on daily. That changes when funding spikes. Check the actual rates for the days you hold, as we did in our squeeze case study.
If your fee tier is higher, or you trade with market orders on thin altcoin perpetuals, the 1H numbers get worse quickly. A setting that looks fine on a daily chart can lose most of its room on 1H for cost reasons alone.
When the bands failed: 1–6 June 2026
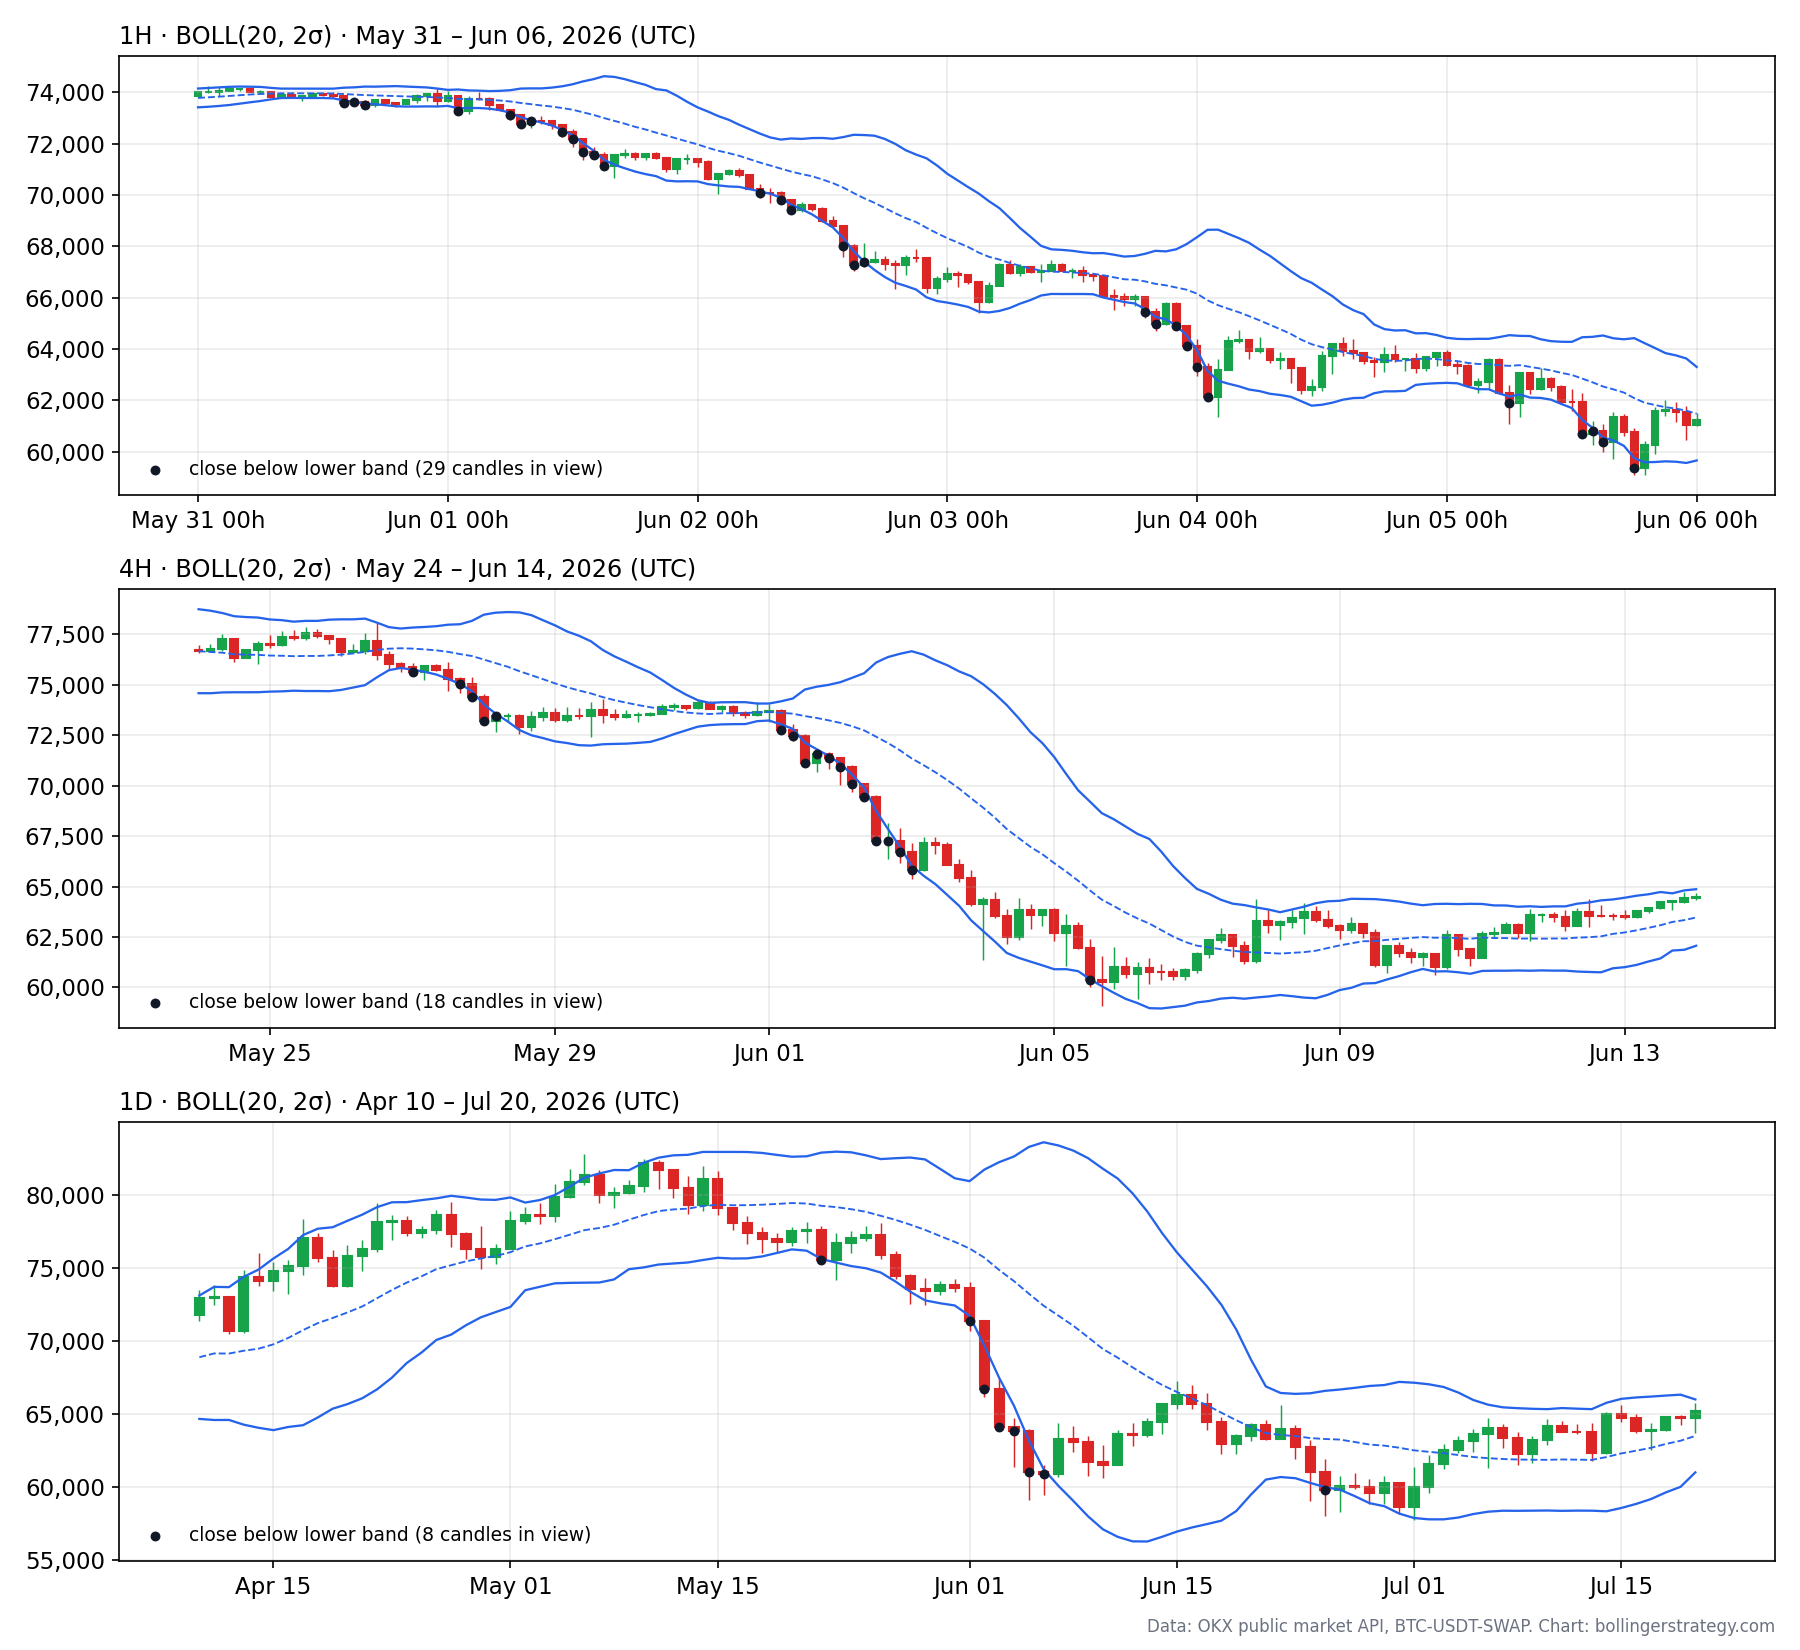
At the end of May the 4H bands on BTC were very narrow. At the 1 June 00:00 UTC candle, the lower band was only 0.57% below the middle band. The next candle closed at 72,777, below the lower band. Then the following eleven 4H candles closed below the lower band too. By the 3 June 00:00 candle the close was 65,824, 9.6% lower.
- On 1H the same drop produced 29 closes below the lower band between 31 May and 5 June, in several separate bursts. Each burst looked like a fresh “oversold” signal.
- On 4H the twelve closes in a row were the longest run below the band in our one-year sample.
- On daily six closes in a row landed below the lower band, from 71,390 on 1 June to 60,849 on 6 June, a fall of 14.8%. The band kept moving down with price, so each close looked “outside” again.
Anyone who treated the first close below the lower band as a buy signal on any of these timeframes was in a losing position for days. The bands widened as the move went on. On 4H the distance from the middle to the lower band went from 0.77% to 7.45% in two days, which shows that volatility was expanding. It does not mean price had gone too far. John Bollinger’s own rules say that a tag of a band is not a signal by itself, and this episode shows why.
How to choose settings for your timeframe
Based on this data, these are the questions worth asking before you change a setting:
- If you trade 1H: check whether your costs leave room for the moves you expect. With 20, 2 bands the typical distance to the middle band was about 1%. Many traders use 1H bands for timing inside a direction they already have from 4H or daily, rather than as a signal by themselves.
- If you trade 4H: 20, 2 gave about 12 signals a month and 20, 2.5 about 6. Pick the one whose signal count you can actually review, then check how it behaved in trending stretches like early June.
- If you use daily bands: expect one or two signals a month and a few large losses that decide the average. Three years of daily data held only 63 signals with 20, 2.
- If you shorten the length to 10: remember that closes cannot reach more than about 2.85σ, so a 3σ band will never be closed outside.
- If you compare with other people’s charts: 20, 2 is the common reference. Changing it makes your levels different from what most traders see.
To see the 20-period and 90-period bands together on live data, open the BTC-USDT-SWAP chart. For how the two sets work together, read how dual Bollinger signals work.
Limits of this test
- One instrument and one exchange. ETH, SOL and smaller perpetuals have different volatility and costs, so the numbers will differ.
- One year of 1H and 4H data. Over that year BTC fell from about 101,400 to 77,400, with daily closes between 58,600 and 106,000. A year with a steady uptrend could change the averages.
- Funding uses one three-month average for the whole sample.
- No slippage, no partial fills, no liquidation. Signals use the close of the candle, which you only know once it has closed.
- The middle-band measurement compares settings. It is not a tested trading system, and we do not report annualized returns.
Frequently asked questions
What are the best Bollinger Band settings for crypto?
There is no setting that works best everywhere. On OKX’s BTC-USDT perpetual from November 2025 to November 2026, the standard 20-period, 2σ bands behaved in a similar way on 1H, 4H and 1D charts: about 12–13% of closes landed outside them. The choice that changed the result most was the timeframe. On 1H, fees were about 10% of the typical distance from a band close back to the middle band, and the average outcome after a close outside the bands was negative before fees.
Should I use 20, 2 or 20, 2.5 on a 4H crypto chart?
In our 4H sample, 2.5σ cut the number of closes outside the bands roughly in half, from 138 to 72 over a year, and a larger share of those signals returned to the middle band first. The sample is small, so treat that as a description of one year, not a rule. If you change the multiplier, compare the new signal count with the old one before you trust the result.
Why does price close outside the 2σ band more often than 5% of the time?
The 5% figure assumes price changes follow a normal distribution and that the bands are measured on data that excludes the current candle. Crypto returns have fat tails and long trending runs, and the standard bands include the current close in their own calculation. In our data the share of closes outside 2σ bands was 9.8% to 14.9%, depending on length and timeframe.
Can a 10-period Bollinger Band with 3 standard deviations ever be touched?
Not by a close. With 10 values and the population standard deviation, no single value can be more than (10 − 1) ÷ √10 ≈ 2.85 standard deviations from the mean, so a close can never reach a 3σ band. Wicks can, because highs and lows are not part of the calculation. Over 20 values the limit is about 4.25σ.
Sources, data and method
- Candles: OKX API, GET /api/v5/market/history-candles ↗, instrument BTC-USDT-SWAP, bars 1H, 4H and 1Dutc, retrieved 4 November 2026.
- Funding: OKX API, GET /api/v5/public/funding-rate-history ↗, 278 realized rates from 3 August to 4 November 2026.
- Fees: OKX fee schedule ↗. We assumed 0.05% per side; your tier may differ.
- Bollinger Band definitions: John Bollinger, Bollinger Band rules ↗.
- The candles, funding records and calculation scripts behind every number on this page are archived by the editorial team. If a number does not match your own data, tell us and we will check it. See our editorial method.